
Diet comparison

Data from 55,000 people in the UK (Scarborough et al., 2023). Values are relative to a high meat-eater (100).

A vegan diet produces about a quarter of the emissions and needs a quarter of the land of a high-meat diet.

Greenhouse gas emissions

Land use

Water use

Scarborough, P. et al. (2023), Nature Food 4, 565–574.

Understanding the diet comparison

Diet labels are useful shortcuts, but the research compares patterns of food consumption, not identities. The charts above show approximate relative impacts from a UK study. Their strongest message is the direction of change, while methods and limits determine how precisely the findings apply.

3 min read
01

What the UK study compared

Scarborough and colleagues linked dietary information from more than fifty thousand people in the UK with environmental impact data. Participants were grouped by their reported diets, including different levels of meat consumption, fish-eaters, vegetarians and vegans. This allows comparison of whole diets rather than just isolated ingredients.

An observational comparison is not a controlled trial assigning everyone identical meals. Participants differ, dietary reporting has limitations and production data include variation. The study nevertheless provides evidence that dietary patterns with fewer animal products can have lower environmental impacts across several dimensions. Read the paper for its methods and uncertainty intervals.

  • Distinguish observational evidence from a feeding trial
  • Use the charts to compare patterns rather than identities
  • Follow the primary paper for uncertainty information
Source: Scarborough et al. · Nature Food · 2023
02

Why the charts use a baseline of 100

A relative chart sets the high-meat group to one hundred and expresses other groups as a proportion of that baseline. A value of twenty-five means about a quarter of the baseline impact. It does not mean twenty-five kilograms of emissions, twenty-five litres of water or twenty-five units of land.

Relative values help compare dimensions that have different physical units, but they hide absolute scale. They also do not tell you your personal impact. The calculator uses a separate simplified annual model, so its numbers should not be derived by multiplying these chart percentages without checking the underlying assumptions.

  • Keep relative percentages separate from absolute quantities
  • Do not read chart values as kilograms or litres
  • Use a clearly stated baseline when sharing a comparison
Source: Scarborough et al. · Nature Food · 2023
03

What changes between diet patterns

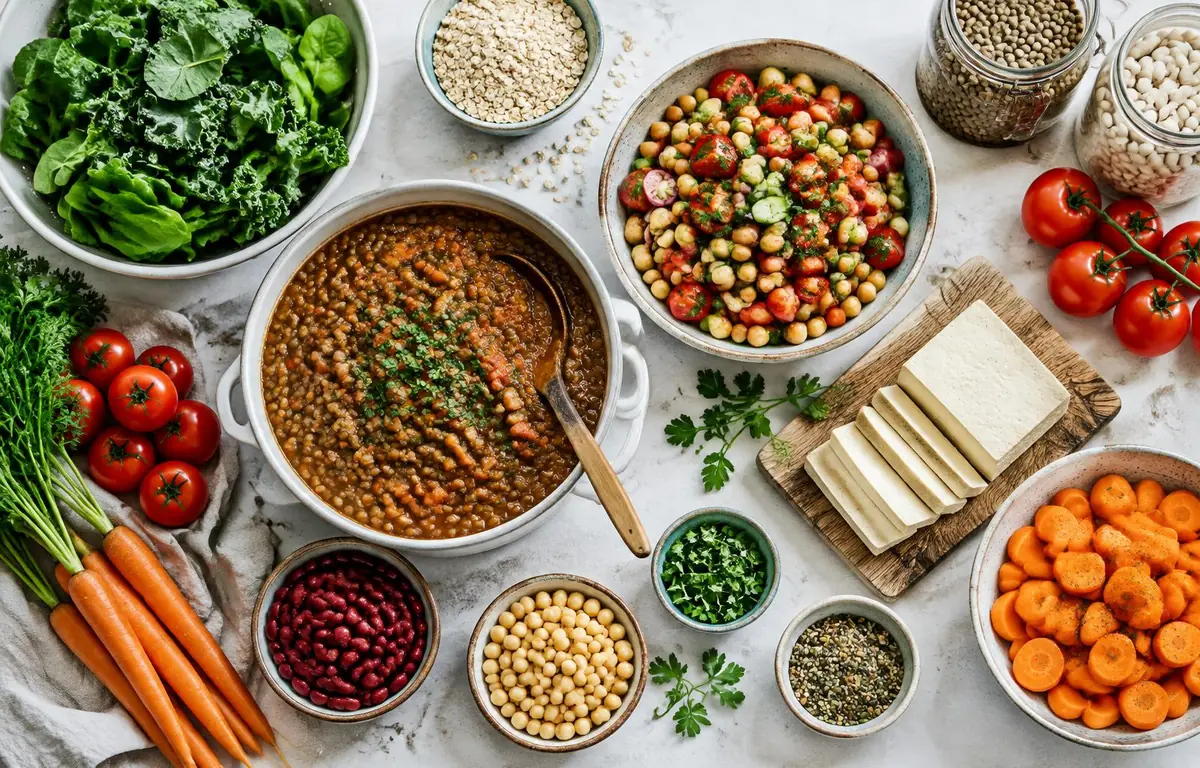
Reducing animal products changes both direct demand and the mix of foods that replace them. Legumes, tofu, whole grains and vegetables have different footprints and nutritional roles. A vegetarian diet may still include substantial dairy, while a vegan diet may rely on varied combinations of staples and processed alternatives.

Broad categories therefore contain many individual diets. Portion sizes, energy requirements and food waste can influence results. The lower average footprint of plant-based patterns is not permission to ignore these details; it is a reason to build a balanced, practical pattern that works for the person eating it.

  • Replace protein foods with appropriate alternatives
  • Include a variety of legumes and whole grains
  • Avoid assuming every diet label means the same menu
Source: Poore & Nemecek · Science · 2018
04

Climate, land and water tell different stories

The three charts measure distinct pressures. Emissions describe warming-related impacts; land use reflects agricultural area demand; water use reflects resource use under the study’s accounting. Their relative reductions are not identical because the processes behind them differ. A single sustainability score would conceal some of this information.

Water interpretation needs particular care because scarcity varies by place. Biodiversity and pollution are also important but are not fully represented by the three displayed charts. Environmental assessment is strongest when several indicators are considered together and when trade-offs are made visible rather than compressed into one flattering number.

  • Compare all displayed indicators
  • Remember that water scarcity depends on location
  • Do not infer complete biodiversity protection from these charts
Source: Our World in Data · Environmental impacts of food
05

Turn a comparison into a workable diet

Environmental information should sit beside nutritional planning. Reliable vitamin B12 is essential for a vegan diet, and calcium, iodine, iron, vitamin D and omega-3 sources deserve attention. A food pattern that looks favourable on an environmental chart is not automatically adequate for a particular person’s health needs.

Choose a few familiar meals, develop staple shopping habits and consult qualified guidance when needed. Children, pregnancy, older age, allergies and medical conditions can require tailored support. The best transition is one that makes environmental improvements while remaining nourishing, accessible and sustainable in everyday practice.

  • Read the nutrition guide before major changes
  • Use fortified foods and a reliable B12 source
  • Ask a qualified professional about specific health requirements
Source: NHS · The vegan diet

Make your next meal count

Join people around the world who have pledged to eat plant-based — for a week, a month or for good. It is free and takes less than a minute.

Take the pledge